AppsFromResearch
MNREAD icon

MNREAD

Evidence Tier:VALIDATED

Initial evidence from research studies

For:Researchers & AcademicsClinicians & Healthcare Professionals

App Summary

The MNREAD app is a digital assessment tool for clinicians and researchers to measure reading performance in adults and children with normal or low vision. A validation study (N=208) demonstrated that the app provides very similar estimates of reading performance parameters compared to the standard printed chart for both normally sighted and low-vision participants. The associated research concludes that the app's metrics can be used to evaluate the real-world impact of ophthalmic treatments, rehabilitation programs, or assistive technologies on reading ability.

App Screenshots

MNREAD screenshot 1 of 3MNREAD screenshot 2 of 3MNREAD screenshot 3 of 3

Detailed Description

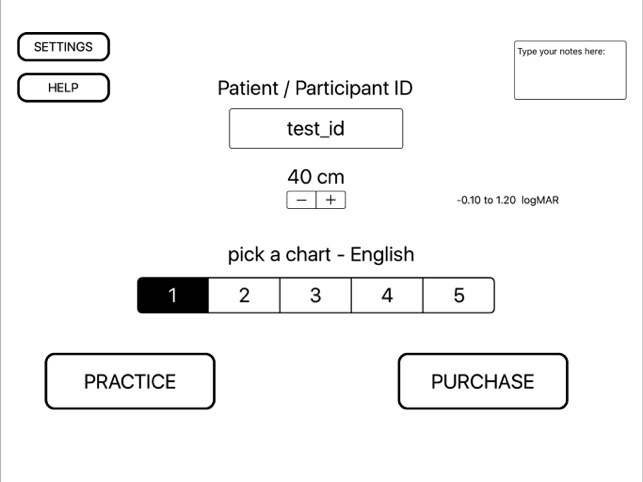
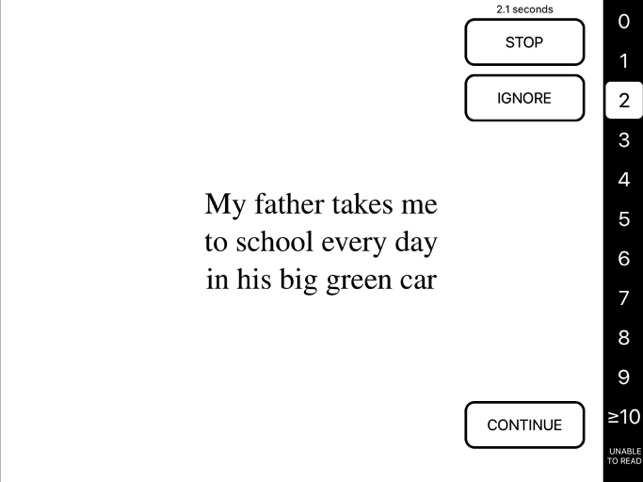
Functionality & Mechanism

Developed at the University of Minnesota, the MNREAD system is a digital reading acuity assessment. The interface presents standardized sentences across 14 print sizes, with options for text polarity. Administration involves the subject reading sentences aloud while an operator records reading time. The system then automatically calculates and graphically displays four primary performance parameters: Reading Acuity, Critical Print Size, Maximum Reading Speed, and the Reading Accessibility Index. Data can be recorded and exported for clinical or research purposes.

Evidence & Research Context

  • A validation study (N=43) in individuals with low vision established that the app yields equivalent measures of Maximum Reading Speed, Critical Print Size, and Reading Accessibility Index compared to the printed chart.
  • In the same study (N=165 normally sighted participants), the app produced slightly slower Maximum Reading Speed estimates (3-12% slower for faster readers), a difference attributed to the digital timing methodology.
  • The app integrates the Reading Accessibility Index (ACC), a metric developed and validated using data from a cohort study of 321 older adults with and without cataracts.
  • The ACC metric demonstrates a stronger correlation with reading-related instrumental activities of daily living (r=-0.60) than with standard visual acuity (r=-0.22), reflecting real-world reading performance.

Intended Use & Scope

This tool is designed for vision scientists, ophthalmologists, and optometrists to quantify visual reading performance. Its primary utility is the standardized measurement and tracking of reading metrics for prescribing optical corrections or evaluating low-vision aids. The system is an assessment aid and does not provide diagnostic or treatment recommendations; interpretation requires professional clinical judgment.

Studies & Publications

2 publications

Peer-reviewed research associated with this app.

Validation Study

Comparing performance on the MNREAD iPad application with the MNREAD acuity chart

Calabr et al. (2017) · Journal of Vision

The iPad app accurately measures reading performance comparably to the printed chart.

Our purpose was to compare reading performance measured with the MNREAD Acuity Chart and an iPad application (app) version of the same test for both normally sighted and low-vision participants. Our methods included 165 participants with normal vision and 43 participants with low vision tested on the standard printed MNREAD and on the iPad app version of the test. Maximum Reading Speed, Critical Print Size, Reading Acuity, and Reading Accessibility Index were compared using linear mixed-effects models to identify any potential differences in test performance between the printed chart and the iPad app. Our results showed the following: For normal vision, chart and iPad yield similar estimates of Critical Print Size and Reading Acuity. The iPad provides significantly slower estimates of Maximum Reading Speed than the chart, with a greater difference for faster readers. The difference was on average 3% at 100 words per minute (wpm), 6% at 150 wpm, 9% at 200 wpm, and 12% at 250 wpm. For low vision, Maximum Reading Speed, Reading Accessibility Index, and Critical Print Size are equivalent on the iPad and chart. Only the Reading Acuity is significantly smaller (I. E., better) when measured on the digital version of the test, but by only 0.03 logMAR (p = 0.013). Our conclusions were that, overall, MNREAD parameters measured with the printed chart and the iPad app are very similar. The difference found in Maximum Reading Speed for the normally sighted participants can be explained by differences in the method for timing the reading trials.
... Read More
Development/Design Paper

Development of a Reading Accessibility Index Using the MNREAD Acuity Chart

Calabr et al. (2016) · JAMA Ophthalmology

Describes the research-driven development of this app
We define a Reading Accessibility Index for evaluating reading in individuals with normal and low vision. To compare the Reading Accessibility Index with data from the Impact of Cataracts on Mobility (ICOM) study. This investigation was a secondary data analysis from the ICOM study performed between July 1, 2014, and September 20, 2015, at 12 eye clinics in Alabama from October 1, 1994, through March 31, 1996. Participants were 321 adults with cataract (n = 92), pseudophakia (n = 131), or natural crystalline lenses without cataract (n = 98). The Reading Accessibility Index (hereafter referred to using the abbreviation ACC for the first 3 letters of Accessibility) is defined as an individual's mean reading speed measured across the 10 largest print sizes on the MNREAD Acuity Chart (Precision Vision) (0.4-1.3 logarithm of the minimum angle of resolution at 40 cm), normalized by 200 words per minute, which was the mean value for a group of 365 normally sighted young adults. The ACC is a single-value measure that captures an individual's range of accessible print sizes and reading fluency within this range. The study cohort comprised 321 participants. Their age range was 55 to 85 years, and 157 (48.9%) were female. The ACCs for the ICOM study participants ranged from 0.19 to 1.33, where 1.00 is the mean value for normally sighted young adults. The ACC for the cataract group (mean [SD], 0.65 [0.18]) was significantly lower than that for the pseudophakia group (mean [SD], 0.77 [0.16]) and the control group (mean [SD], 0.76 [0.19]) (P < .001 for both). The correlation between the ACC and Early Treatment Diabetic Retinopathy Study visual acuity (r = -0.22) and Pelli-Robson contrast sensitivity (r = 0.20) was weaker than that with a reading-related measure of instrumental activities of daily living (r = -0.60) (P < .001 for both). The ACC represents an individual's access to text across the range of print sizes found in everyday life. Its calculation does not rely on curve fitting and provides a direct comparison with the performance of normally sighted individuals. Changes in an individual's ACC might be used to evaluate the effect of ophthalmic treatment, rehabilitation programs, or assistive technology on reading accessibility. Data from the ICOM study show that the ACC reflects characteristics of reading performance in everyday life and is sensitive to improved reading accessibility for pseudophakic eyes.
... Read More

MNREAD

Free