Project FeederWatch
Published in academic literature
App Summary
App Screenshots
Detailed Description
Functionality & Mechanism
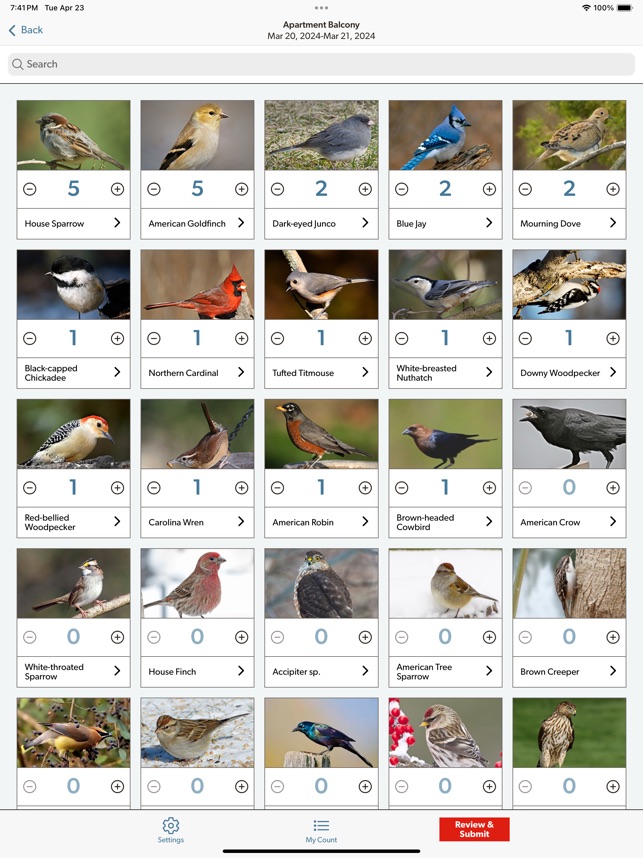
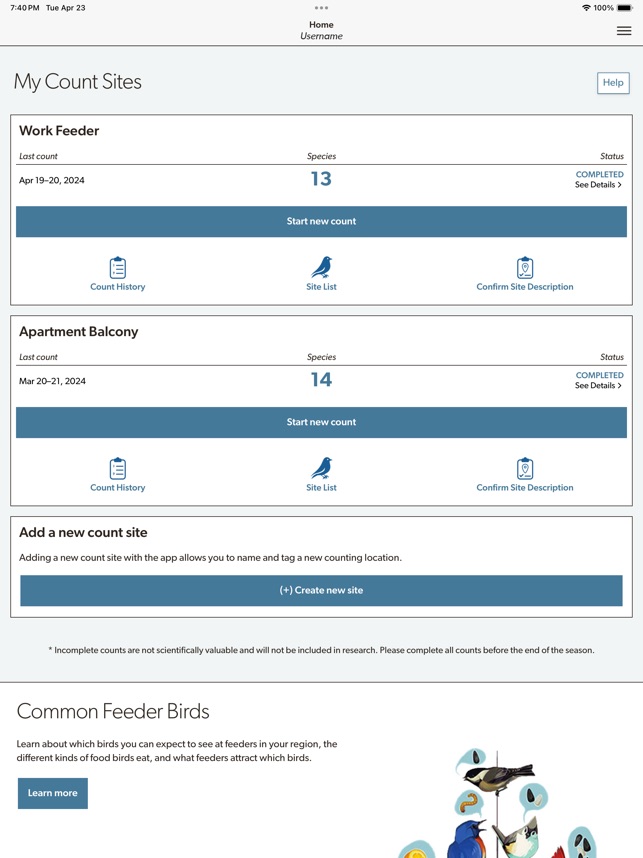
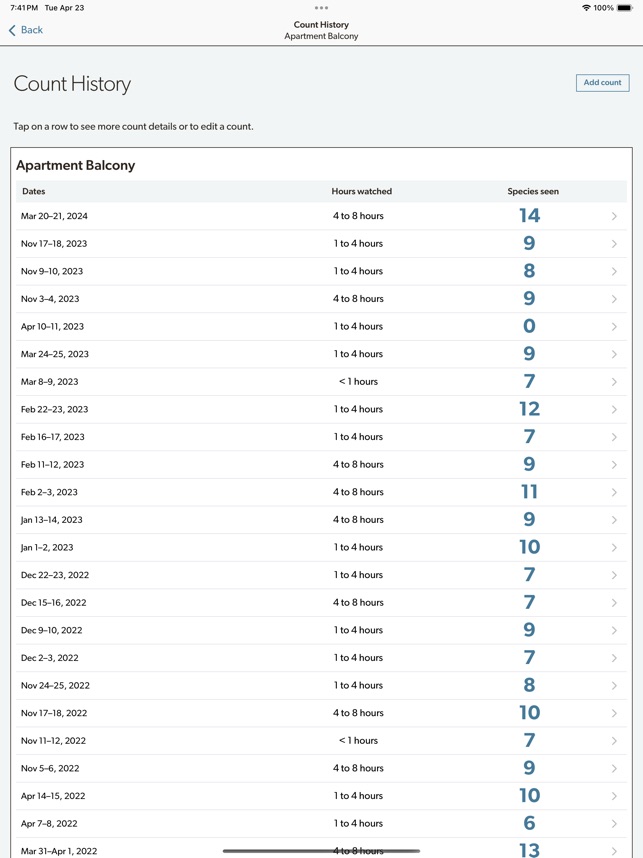
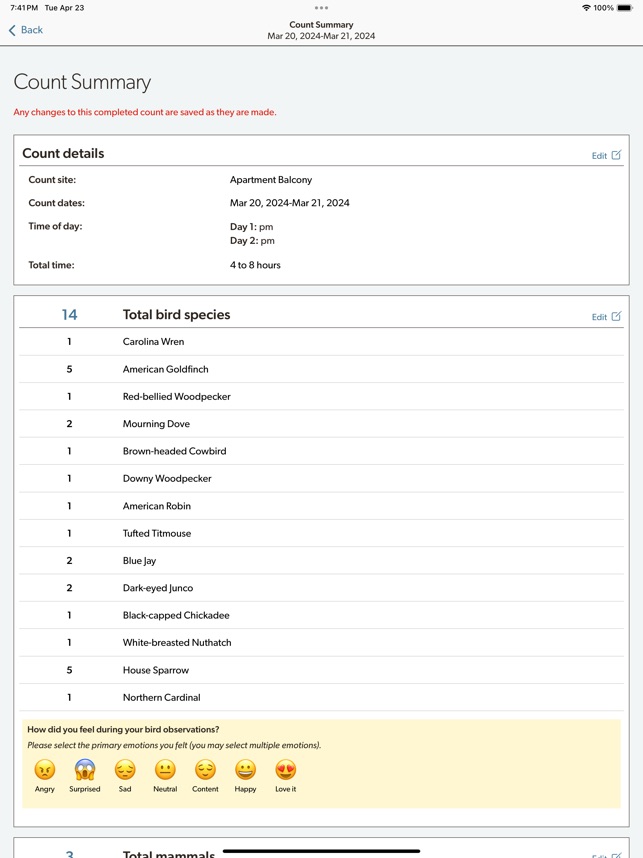
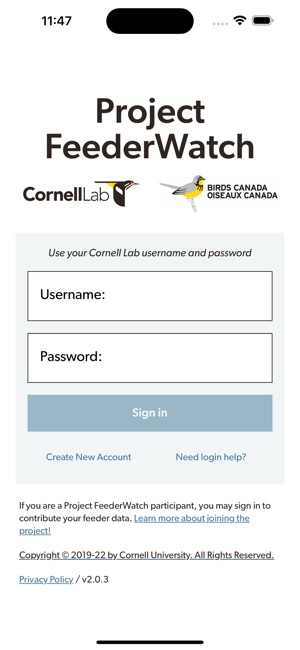
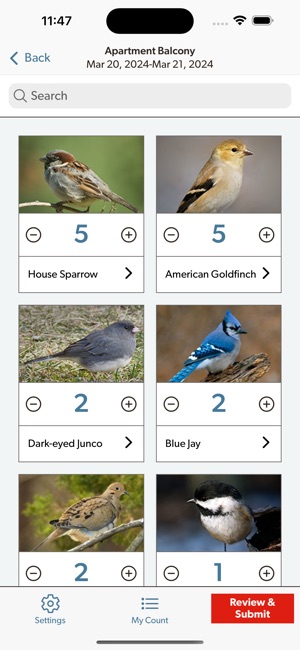
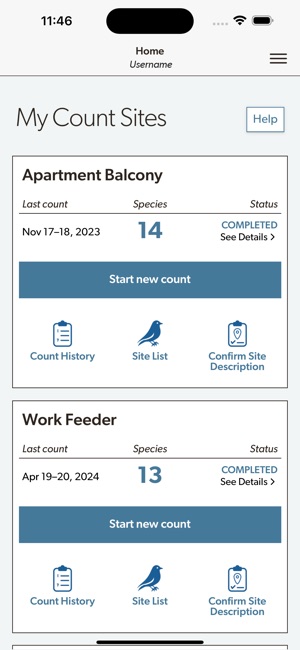
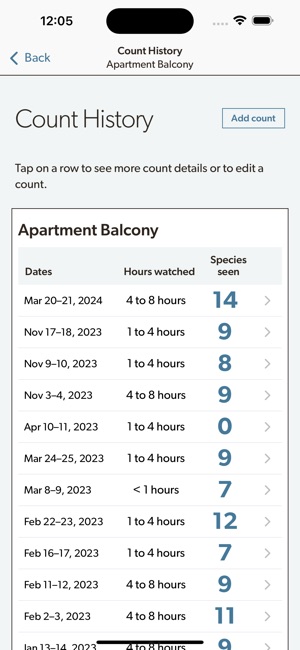
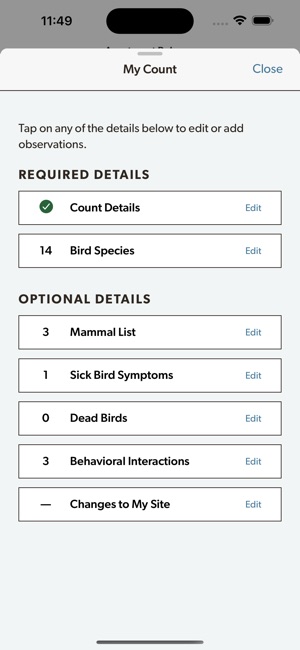
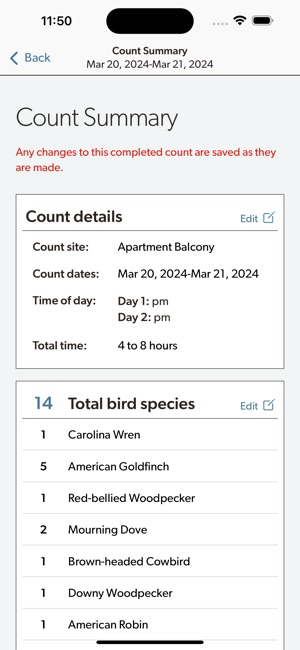
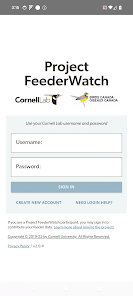
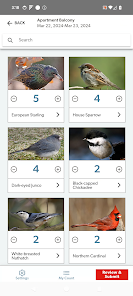
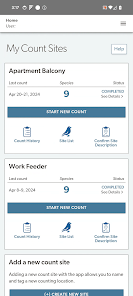
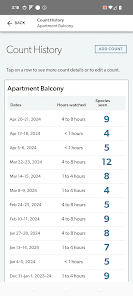
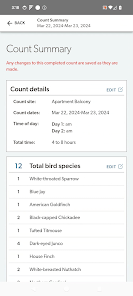
Developed by the Cornell Lab of Ornithology and Birds Canada, the Project FeederWatch system facilitates citizen science data collection on North American winter feeder-bird populations. Participants follow a standardized protocol, recording the maximum number of individuals for each species observed at a designated count site over a two-day checklist period. The mobile interface captures these counts, syncs with a web-based portal for multi-platform data management, and provides access to sighting statistics and historical count archives.
Evidence & Research Context
- The mobile application contributes to a longitudinal dataset spanning over 30 years, collating approximately 180,000 checklists annually from more than 25,000 participants across North America.
- Data collected through the project have been utilized in dozens of peer-reviewed publications to investigate ecological topics including climate change impacts, disease ecology, and invasive species dynamics.
- The system incorporates a data validation protocol where automated filters flag geographically or temporally unexpected observations (1.52% of records) for subsequent expert review before final inclusion.
- Independent analyses indicate consistency between avian population trends identified in FeederWatch data and those from other large-scale ornithological surveys, suggesting robust data quality despite its citizen science origin.
Intended Use & Scope
This system is designed for use by the general public as a citizen science data collection tool. Its primary utility is to enable standardized, longitudinal reporting of winter bird populations in North America for the Project FeederWatch database. The tool is not a comprehensive field guide for bird identification or a general-purpose sighting log for use outside the project protocol.
Studies & Publications
Peer-reviewed research associated with this app.
Over 30 Years of Standardized Bird Counts at Supplementary Feeding Stations in North America: A Citizen Science Data Report for Project FeederWatch
Bonter et al. (2021) · Frontiers in Ecology and Evolution
Referenced in academic literature; no direct evaluation of the appInsights from Project FeederWatch: Changes in the abundance and occurrence of birds in New Hampshire over the past 24 years
Sutcliffe et al. (2014)
Referenced in academic literature; no direct evaluation of the appIn the Media
Opening the door to science for all
Virginia Tech professor Ashley Dayer developed a study to make Project FeederWatch more welcoming to diverse participants, using research partnerships with Cornell University, North Carolina State University, and The Ohio State University. "Participatory science has been a great success for research, but not everyone feels these projects are designed for them, which limits their benefits and creates data gaps," Dayer said. The study, published November 11 in Citizen Science: Theory and Practice, recommends that the Cornell Lab of Ornithology program collaborate with community organizations and develop better educational resources.
Cornell Lab of Ornithology Prepares for Project FeederWatch
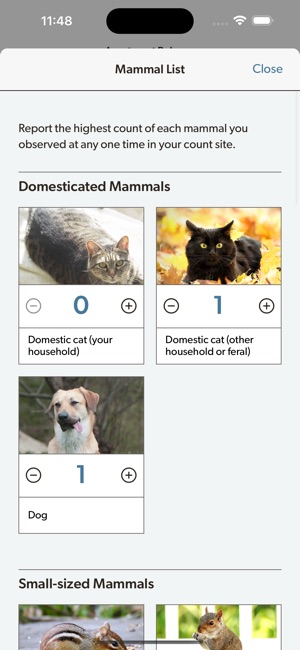
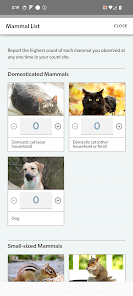
The Cornell Lab of Ornithology developed Project FeederWatch to understand winter bird populations and climate change impacts, inviting participants across the United States and Canada to observe and report bird species from feeders. Supported by a National Science Foundation grant, the project has expanded to include reports on mammals and sick birds, with project leader Emma Greig stating, "If participants see sick birds or a predation event, for example, how does it change how they feel overall about birds and bird feeding?" This year's season runs from November 1 through April 30, with thousands of FeederWatchers contributing data to the research database.
Project FeederWatch Media Release
Birds Canada and Cornell Lab of Ornithology developed Project FeederWatch to help understand wild bird populations by engaging citizens in backyard bird observation during winter months. The program requires "as little as 15 minutes every few weeks from 14 November to 9 April" and attracts over 70,000 volunteers annually who contribute to citizen science programs. Information from Project FeederWatch helps make conservation decisions that improve outcomes for 40 high-conservation-priority bird species.
Technology sends Project FeederWatch soaring at 30
Cornell Lab of Ornithology developed Project FeederWatch to track backyard feeder bird populations through citizen science, transitioning from paper forms to fully digital data collection over its 30-year history. "The 30th season is the first season that we aren't scanning paper forms anymore, we're just doing digital," said Emma Greig, Project FeederWatch leader at the Cornell Lab of Ornithology. The program now engages 20,000 participants across the U.S. and Canada, creating one of the largest databases of feeder bird populations in the world.
30 Years of Project FeederWatch Yield New Insights About Backyard Birds
The Cornell Lab of Ornithology and Bird Studies Canada developed Project FeederWatch in 1987 to mobilize thousands of citizen scientists across North America to count backyard birds during winter months. "Cardinals, like people, appreciate a free lunch," says David Bonter, the Cornell Lab's Arthur A. Allen director of citizen science, explaining how Northern Cardinals have expanded their range northward since 1989 by adapting to suburban environments with abundant feeders. Three decades of data reveal compelling stories of range expansions and contractions among feeder birds across the late 20th and early 21st centuries.
App Information
Developer
Cornell UniversityCategory
Evidence Profile
Published in academic literature
Platforms
Updated
May 2026
© 2025 Cornell University