AppsFromResearch
NVS Explorer icon

NVS Explorer

Published in academic literature

For:Researchers & AcademicsGeneral Public & EnthusiastsIndustry Professionals

App Summary

NVS Explorer provides stakeholders in the Pacific Northwest, including fishers, emergency managers, and shellfish growers, with one-stop access to aggregated ocean, coastal, and atmospheric data from a diversity of observing systems. The associated research describes a flexible, stakeholder-driven design process, where customized data applications are developed in close coordination with specific user groups to meet their unique needs. This approach, the authors note, increases the capacity of users to understand and better respond to ongoing regional environmental changes.

App Screenshots

NVS Explorer screenshot 1 of 12NVS Explorer screenshot 2 of 12NVS Explorer screenshot 3 of 12NVS Explorer screenshot 4 of 12NVS Explorer screenshot 5 of 12NVS Explorer screenshot 6 of 12NVS Explorer screenshot 7 of 12NVS Explorer screenshot 8 of 12NVS Explorer screenshot 9 of 12NVS Explorer screenshot 10 of 12NVS Explorer screenshot 11 of 12NVS Explorer screenshot 12 of 12

Detailed Description

Functionality & Mechanism

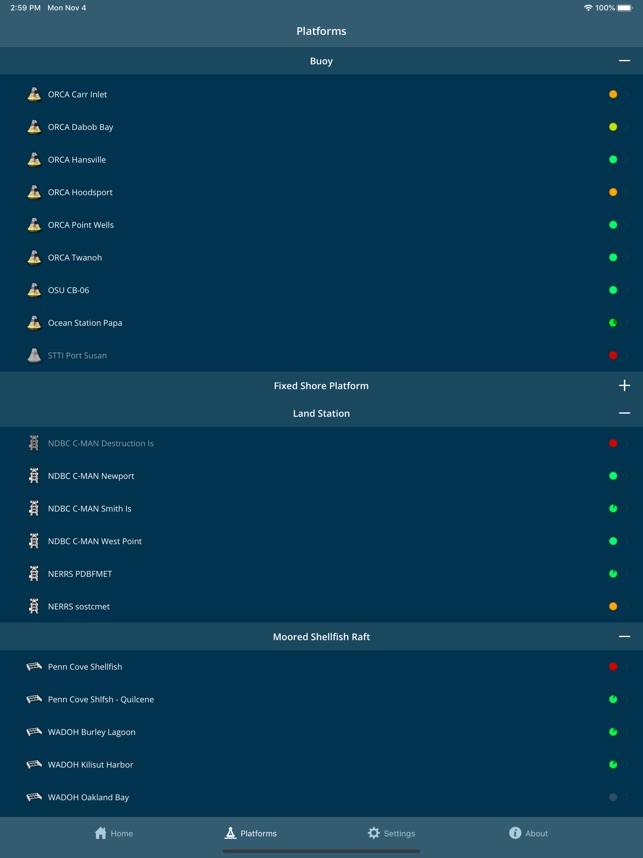
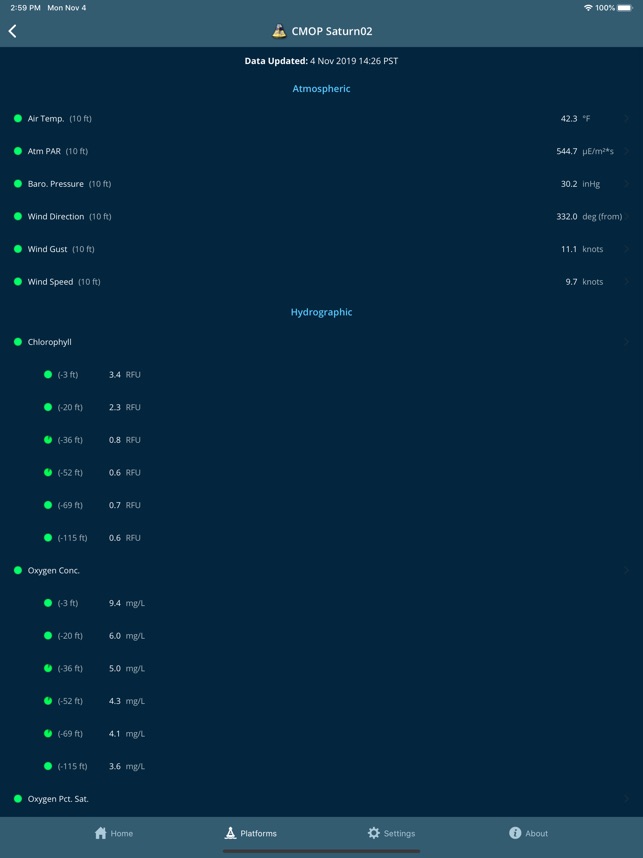
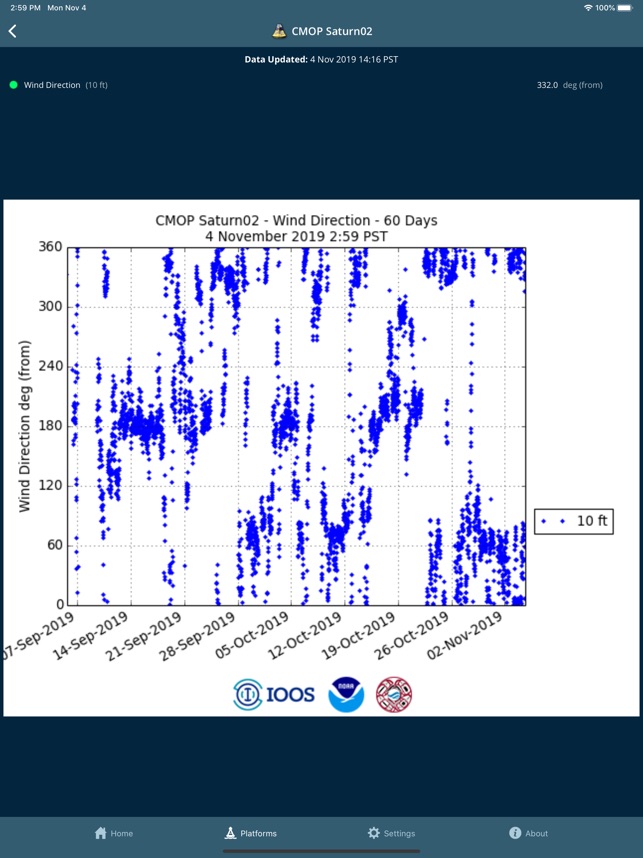
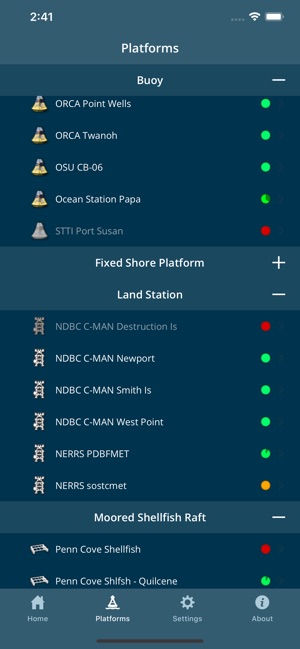
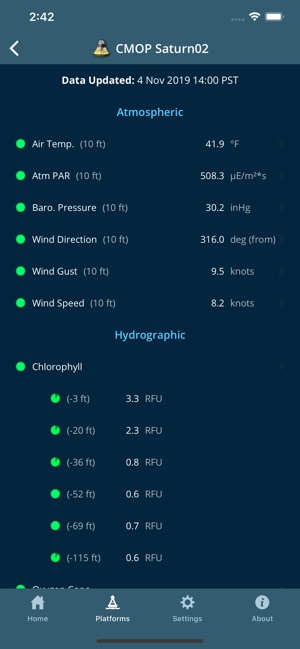
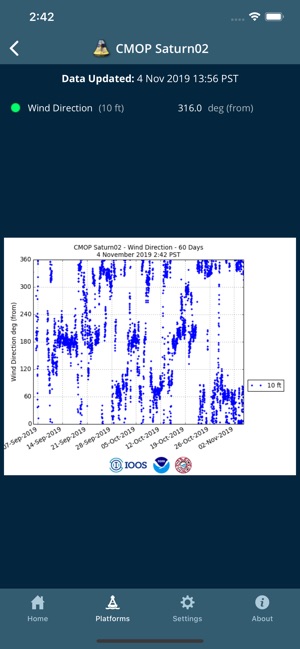
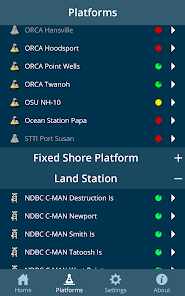
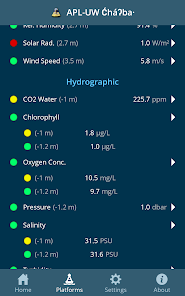
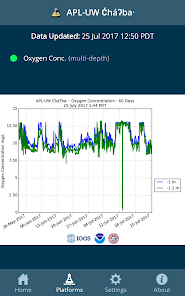
Developed by the Northwest Association of Networked Ocean Observing Systems (NANOOS), this system aggregates and visualizes near real-time oceanographic and meteorological data for the Pacific Northwest. The map-based interface facilitates navigation to diverse observing assets, including buoys and coastal stations. The system generates plots of current conditions or trends over 24-hour to 30-day intervals. Data visualizations can be saved locally or shared via standard communication protocols, with options for scientific or common units.

Evidence & Research Context

  • The system's design, detailed in associated research, establishes a platform for aggregating diverse coastal, ocean, and atmospheric data into a single interface.
  • The NVS framework leverages established data access protocols (e.g., OGC, OPeNDAP) to integrate heterogeneous data from federal, tribal, academic, and state sources.
  • Development involved a formal design process with stakeholder groups, including commercial fisheries, shellfish growers, and emergency managers, to create custom applications.
  • The platform is engineered for flexibility, enabling the rapid prototyping and refinement of specialized tools to meet specific regional environmental information needs.

Intended Use & Scope

Intended for marine stakeholders—including researchers, commercial fishers, resource managers, and emergency planners—the system functions as a data visualization and environmental monitoring tool. It provides direct access to aggregated near real-time observational data. The system does not provide prognostic interpretation; users must apply expert knowledge for decision-making and risk assessment.

Studies & Publications

2 publications

Peer-reviewed research associated with this app.

Development/Design Paper

The NANOOS Visualization System (NVS): A Decade of Development and Progress Addressing Stakeholder Needs

Risien et al. (2019) · OCEANS 2019 MTS/IEEE SEATTLE

Describes the research-driven development of this app
Over the past few decades coastal regions have experienced considerable socio-economic change. Accompanying these socio-economic shifts are unprecedented environmental changes, which include variation in magnitude and frequency of extreme weather events, marine heatwaves, increased ocean acidification, expansion of dead zones, extreme harmful algal blooms, and accelerating sea level rise. To understand these emerging environmental shifts, the past two decades have witnessed increased capacity to monitor changing environmental conditions and predict with greater accuracy such variations and events. These observation and prediction systems produce ever increasing amounts of data. Ongoing efforts to deliver this information using standard data models, metadata, data access protocols, and community accepted data server applications have helped reduce the heterogeneity of these data and improved data distribution. However, delivering critical information to stakeholders in a user-friendly and accessible manner remains a challenge. Beginning in 2009, the Northwest Association of Networked Ocean Observing Systems (NANOOS), the U.S. Integrated Ocean Observing System (IOOS) regional association for the Pacific Northwest, began to address this challenge by developing the NANOOS Visualization System (NVS), a map-based platform that aggregated a multitude of diverse data sets and forecast model fields into one system with the goal of delivering a more seamless, one-stop-shopping experience for users of coastal, ocean and atmospheric data. Here we describe the early vision and development of NVS and how it evolved into a flexible, multi-application platform where customized web applications can be developed to meet the needs of specific stakeholder groups. We focus on three applications (Seacast, Shellfish Growers, and Tsunami Evacuation Zones) that were developed using more formal design processes in close coordination with commercial crab fishermen, shellfish growers, and state and local emergency managers. In addition, we briefly describe the Tuna Fishers application, which evolved out of informal discussions with recreational tuna fishers. In highlighting these applications, we demonstrate the flexibility of NVS to quickly spin up prototype applications using pre-existing NVS framework elements. Working closely with small groups of dedicated stakeholders, we are then able to refine and extend an application before releasing it to the broader audience. Such a capability has enabled NANOOS to truly meet stakeholder needs, while increasing user capacity to understand and better respond to ongoing regional environmental changes.
... Read More
Development/Design Paper

The NANOOS Visualization System: Aggregating, displaying and serving data

Risien et al. (2009) · OCEANS 2009, MTS/IEEE Biloxi

Describes the research-driven development of this app
The Northwest Association of Networked Ocean Observing Systems (NANOOS) is one of eleven Regional Associations of the US Integrated Ocean Observing System (IOOS). NANOOS serves the Pacific Northwest from the US/Canada border to Cape Mendocino on the northern California coast. Its mission is to coordinate and support the development, implementation, and operations of a regional coastal ocean observing system (RCOOS) for the Pacific Northwest region, as part of IOOS. A key objective for NANOOS is to provide data and user-defined products regarding the coast, estuaries and ocean to a diverse group of end users in a timely fashion, and at spatial and temporal scales appropriate for their needs. To this end, NANOOS is developing a web mapping portal, the NANOOS Visualization System (NVS), that aggregates, displays and serves near real-time coastal, estuarine, oceanographic and meteorological data, derived from buoys, gliders, tide gauges, HF Radar, meteorological stations, satellites and shore based coastal stations, as well as model forecast information in such a way that it presents end users with a rich, informative and meaningful experience. NVS makes use of a variety of services, including the Google Maps service and a data translation and visualization service known as ERDDAP (Environmental Research Division's Data Access Program), compliant Open Geospatial Consortium (OGC) web standards such as the Sensor Observation Service (SOS), Web Map Service (WMS), and Keyhole Markup Language (KML), as well as the Open-source Project for a Network Data Access Protocol (OPeNDAP) as served and cataloged by the NANOOS THREDDS (Thematic Realtime Environmental Distributed Data Services) Data Server (TDS). These heterogeneous data streams are transformed on-the-fly to other formats or representations, which NVS makes available to the end user via a Google Maps interface. We will describe in detail the NVS development process and will demonstrate the ability of NVS to serve as a portal for one-stop access to near real-time regional data and forecast products, including NOAA's first seven ?core variables? (ocean currents, temperature, salinity, water level, waves, chlorophyll and surface winds), by describing the data flows from NANOOS funded coastal and ocean observing and forecasting assets as well as Federal assets. In addition, we will describe future development plans that include greater functionality, iteratively improving NVS based on feedback received at planned training workshops and from identified stakeholders, and updating NVS to be compliant with future IOOS and OGC standards.
... Read More

NVS Explorer

Free