AppsFromResearch
Polar Explorer: Sea Level icon

Polar Explorer: Sea Level

Evidence Tier:DOCUMENTED

Published in academic literature

For:General Public & Enthusiasts

App Summary

Polar Explorer: Sea Level is an educational tool designed for the public, students, and planners to explore the science of sea level change through interactive data maps and guided 'quests'. The app's design is grounded in the educational principle that allowing users to directly interact with complex scientific datasets from sources like NOAA and NASA fosters deeper insight and independent discovery. The associated research concludes that the app serves as an effective communication tool, making complex climate data accessible and useful for education, public engagement, and community planning.

App Screenshots

Polar Explorer: Sea Level screenshot 1 of 8Polar Explorer: Sea Level screenshot 2 of 8Polar Explorer: Sea Level screenshot 3 of 8Polar Explorer: Sea Level screenshot 4 of 8Polar Explorer: Sea Level screenshot 5 of 8Polar Explorer: Sea Level screenshot 6 of 8Polar Explorer: Sea Level screenshot 7 of 8Polar Explorer: Sea Level screenshot 8 of 8

Detailed Description

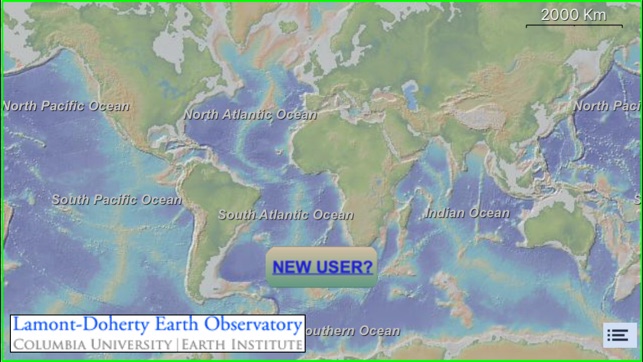
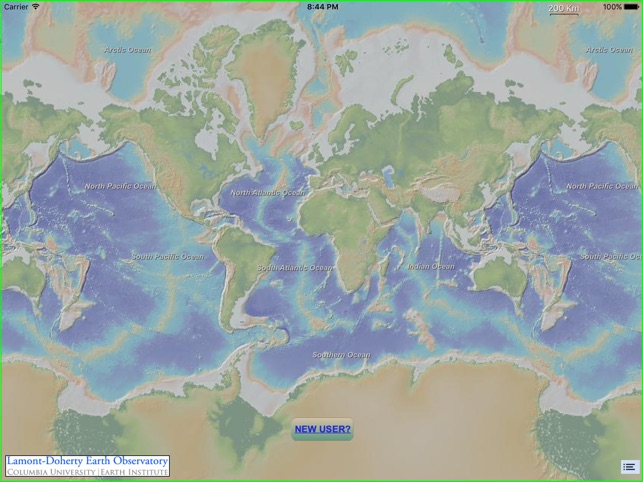
Functionality & Mechanism Developed by researchers at Columbia University's Lamont-Doherty Earth Observatory, the system facilitates exploration of climate science through interactive, layered data maps. The interface is structured around core scientific questions, guiding engagement across more than 100 topics on past, present, and future sea level. Sessions involve tactile interaction with visualized datasets from sources including NOAA and NASA, supplemented by audio narration, text summaries, and problem-solving 'quests' to deepen pedagogical engagement.

Evidence & Research Context

  • The app's design is grounded in the pedagogical principle that direct, interactive visualization of scientific data enhances public understanding of complex climate processes.
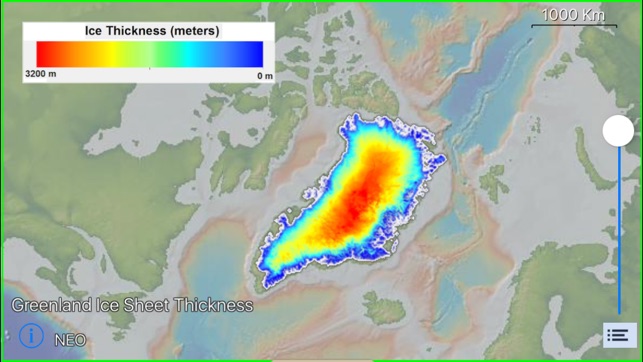
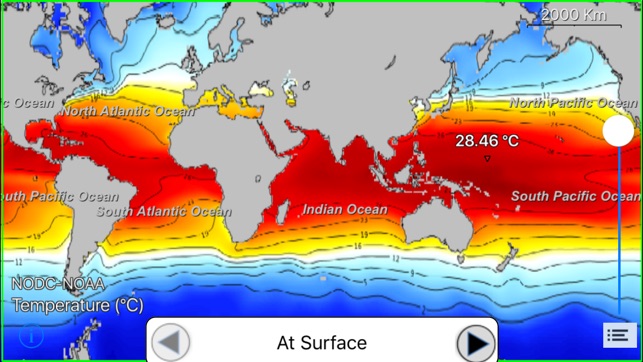
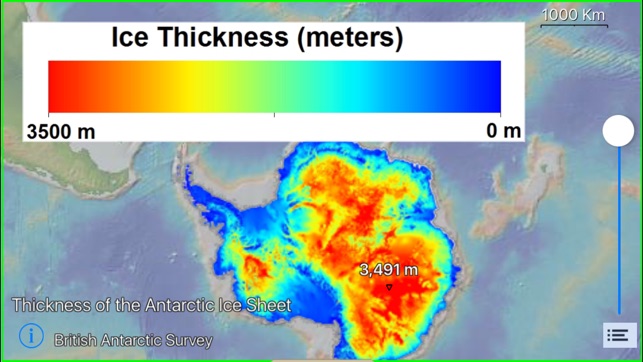
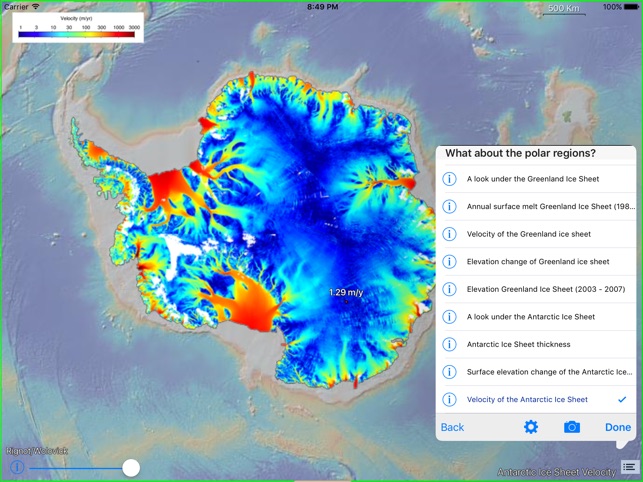
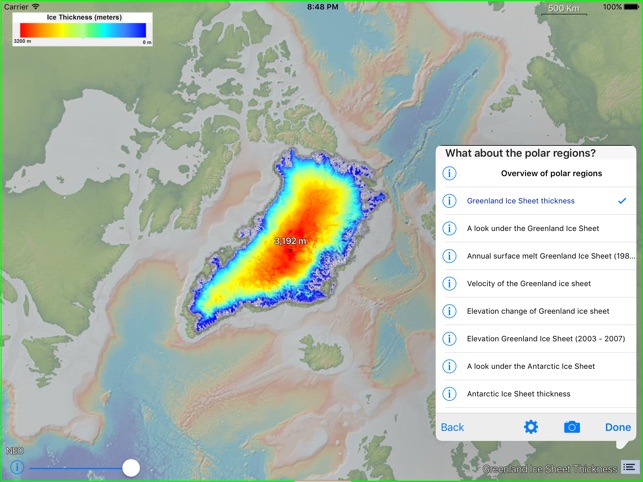
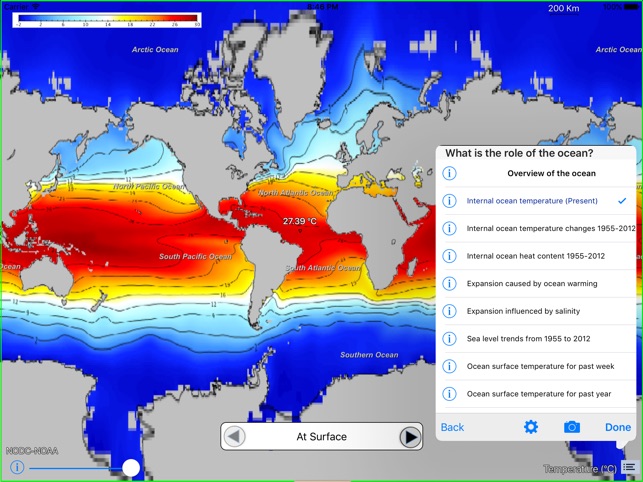
  • The system integrates vetted geospatial datasets from primary scientific sources to visualize concepts including ocean temperature, ice sheet mass, and storm surge risk.
  • Associated publications identify the app as a resource for informal public education and for formal undergraduate instruction in geoscience.
  • The platform has been utilized as a communication tool in community and regional planning contexts to articulate climate impacts and support decision-making.

Intended Use & Scope The system is designed for educators, students, municipal planners, and the general public. Its primary utility is as a data visualization and educational resource that translates complex climate datasets into an accessible, interactive format. The app does not generate predictive models or provide real-time environmental alerts; it serves to illustrate established scientific concepts and data.

Studies & Publications

5 publications

Peer-reviewed research associated with this app.

Development/Design Paper

Three Pillars of Success: The Partners, The Messenger, The Communication Strategies

Turrin et al. (2017)

Describes the research-driven development of this app
Our ability to deal with climate impacts in coastal cities and bring change, hinges on our ability to effectively communicate impacts. Incorporating sea level rise and climate impacts into city planning and community action plans is too often done in response to a devastating impact rather than through preventative planning. In New York the impact came in the form of Hurricane Sandy. Prior to Sandy, NYC, NY State and regional scientists had prepared planning documents, reports and communications directed at public officials and decision makers, warning of potential impacts from a changing climate. Presentations and reports identified the most exposed locations and infrastructure, but disbelief and a false sense of time mired any meaningful change. Effective communication about climate and impacts is at the root of planning and resilience. To be meaningful it must come from a trusted messenger, use well vetted materials that address both larger climate processes and drivers and local impacts, be accessible to the non-science community, and incorporate multiple modes of communication. The Polar Explorer: Sea Level app is a tool that has been used to this end (http://www.polarexplorer.org). An interactive multi-layered communication tool, it uses vetted data structured through a series of commonly asked questions and displayed through visualizations. We have been partnering with New York State, local community groups, and state and educational organizations to reach a broad cross section of the public with information useful for planning. We have co-presented at conferences for local planning and advisory groups, and incorporated the use of the app into local planning charrettes and have found the visualizations, interactivity of the delivery and the layered scaffolding make the app a useful tool for planners and decision makers. The app includes the physical science drivers of climate change and the social science impacts, and a look at the past the present and future projections. For planners and coastal managers the section on "Who is Vulnerable?' highlighting areas most often impacted by weather and extreme events, provides data useful in planning for extreme events. Whatever the challenges changing climate brings, we must address the challenge of communicating in an interactive, visual and accessible way.
... Read More
Development/Design Paper

A Quest to Put Sea Level Rise Data in Your Pocket

Sidder et al. (2016) · Eos

Describes the research-driven development of this app
This article reports on the launch of Polar Explorer: Sea Level, a mobile application developed by researchers at Columbia University's Lamont-Doherty Earth Observatory to democratize access to climate data. Presented at the American Geophysical Union's Fall Meeting, the app is designed to bridge the gap between complex scientific datasets and public understanding by transforming raw data into interactive, clickable map layers. Users can explore seven core topics, such as regional sea level trends and storm surge risks, through a combination of visual data, audio narratives, and text summaries. To further deepen engagement, the app includes "quests" that challenge users to solve specific climate-related problems. While currently exclusive to iOS platforms, the tool has been praised for its ability to frame real-time data from NOAA and NASA within compelling narratives, making it a potentially valuable resource for both general education and undergraduate instruction.
... Read More

In the Media

How can we better visualize sea-level rise data?

Columbia researchers developed Polar Explorer: Sea Level to make daunting climate change data accessible and easier to understand, using interactive maps that pull data from NOAA and NASA. The app organizes content around seven "big question" categories, including "What is sea level?" and "What are future predictions for the US coast?" Users can select from various map layers to visualize effects like tide stations worldwide, regional sea-level trends, or areas vulnerable to future coastal flooding.

ColumbiaRead article

Sea for Yourself: Exploring Sea Level Rise through the Polar Explorer (Grades 7-12)

Columbia University's Lamont-Doherty Earth Observatory developed Polar Explorer: Sea Level to help students understand sea level changes through interactive data visualizations and maps. The web-based app guides investigations into why sea levels change, how they vary globally, and their local impacts, with presenters noting that sea level rise averaged 3.2mm per year from 1993-2010. Director Margie Turrin and Education Program Assistant Laurel Zaima lead educational sessions using the platform for grades 7-12.

ColumbiaRead article

A Quest to Put Sea Level Rise Data in Your Pocket

Columbia University's Lamont-Doherty Earth Observatory developed Polar Explorer: Sea Level to remove barriers between the public and often inaccessible climate data, using clickable, data-based map layers to explore sea level rise questions. "Just getting people to go and interact with it and realize, 'Oh! It's actually data,' is a pretty important thing," said Margie Turrin, education coordinator at Lamont-Doherty and project lead. The app structures content around seven "big question" categories, with each functioning like a book chapter that offers multiple map layers to help users understand topics like current sea level changes and future coastal predictions.

EosRead article

Polar Explorer: Sea Level

Free